whatsapp x

WhatsApp Number

917200964014

Message
email x
info@the-stair.com
Data Analytics & Visualization tools - STAIR

Data Analytics & Visualization tools

Data ​Analytics & Visualization Tools

Data analytics involves analyzing data to gain insights and make informed decisions. Power BI is a popular tool for visualizing and analyzing data from various sources. Together, data analytics and Power BI can help businesses gain valuable insights and make data-driven decisions to improve performance and gain a competitive edge. By leveraging these tools, businesses can identify opportunities for improvement and optimize their operations.
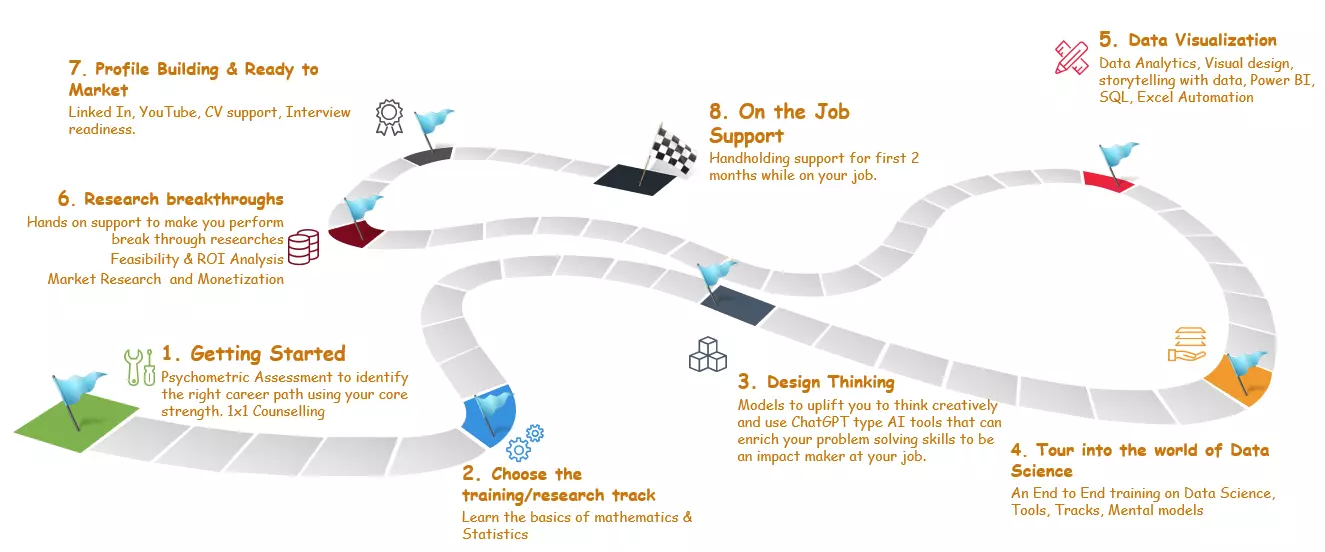
Data Analytics & Visualization tools Course Roadmap

"The Journey to your future readiness begins here"

Getting Started​

Psychometric Assessment to identify the right career path using your core strength. 1x1 Counselling

Choose the training/research track

Learn the basics of mathematics & Statistics 

Design Thinking

Models to uplift you to think creatively and use ChatGPT type AI tools that can enrich your problem solving skills to be an impact maker at your job.

Tour into the world of Data Science

An End to End training on Data Science, Tools, Tracks, Mental models

Data Visualization​

Data Analytics, Visual design, storytelling with data, Power BI, SQL, Excel Automation

Research breakthroughs​

Hands on support to make you perform break through researches Feasibility & ROI Analysis Market Research  and Monetization

Profile Building & Ready to Market

Linked In, YouTube, CV support, Interview readiness

On the Job Support

Handholding support for first 2 months while on your job.

Data-Analytics-and-power-BI
You got this!
You're doing greate, keep the answering the questions